Eureka!’s Stages
Overview
Eureka! is broken down into six “stages” which each consist of many “steps”. The six stages are as follows (a visual overview is also provided in Figure 1):
Stage 1: An optional step that calibrates raw data (converts ramps to slopes for JWST observations). This step can be skipped within
Eureka!if you would rather use the Stage 1 outputs from thejwstpipeline.Stage 2: An optional step that further calibrates Stage 1 data (performs flat-fielding, unit conversion, etc. for JWST observations). This step can be skipped within
Eureka!if you would rather use the Stage 2 outputs from thejwstpipeline.Stage 3: Using Stage 2 outputs, performs background subtraction and optimal spectral extraction. For spectroscopic observations, this stage generates a time series of 1D spectra. For photometric observations, this stage generates a single light curve of flux versus time.
Stage 4: Using Stage 3 outputs, generates spectroscopic light curves by binning the time series of 1D spectra along the wavelength axis. Optionally removes drift/jitter along the dispersion direction and/or sigma clips outliers.
Stage 5: Fits the light curves with noise and astrophysical models using different optimization or sampling algorithms.
Stage 6: Displays the planet spectrum in figure and table form using results from the Stage 5 fits.
A more detailed look at the steps taken in stages 3 and 4 are summarized below.
Stages 1 and 2 are not covered in depth as they basically just offer a wrapper for the jwst pipeline which has already documented their
Stage 1,
Stage 2 (spectroscopy), and
Stage 2 (photometry).
Stage 5 is not covered as it is a fairly standard fitting routine without a great deal of complexity.
Stage 6 is not covered in depth as it is mostly just a convenience plotting tool.
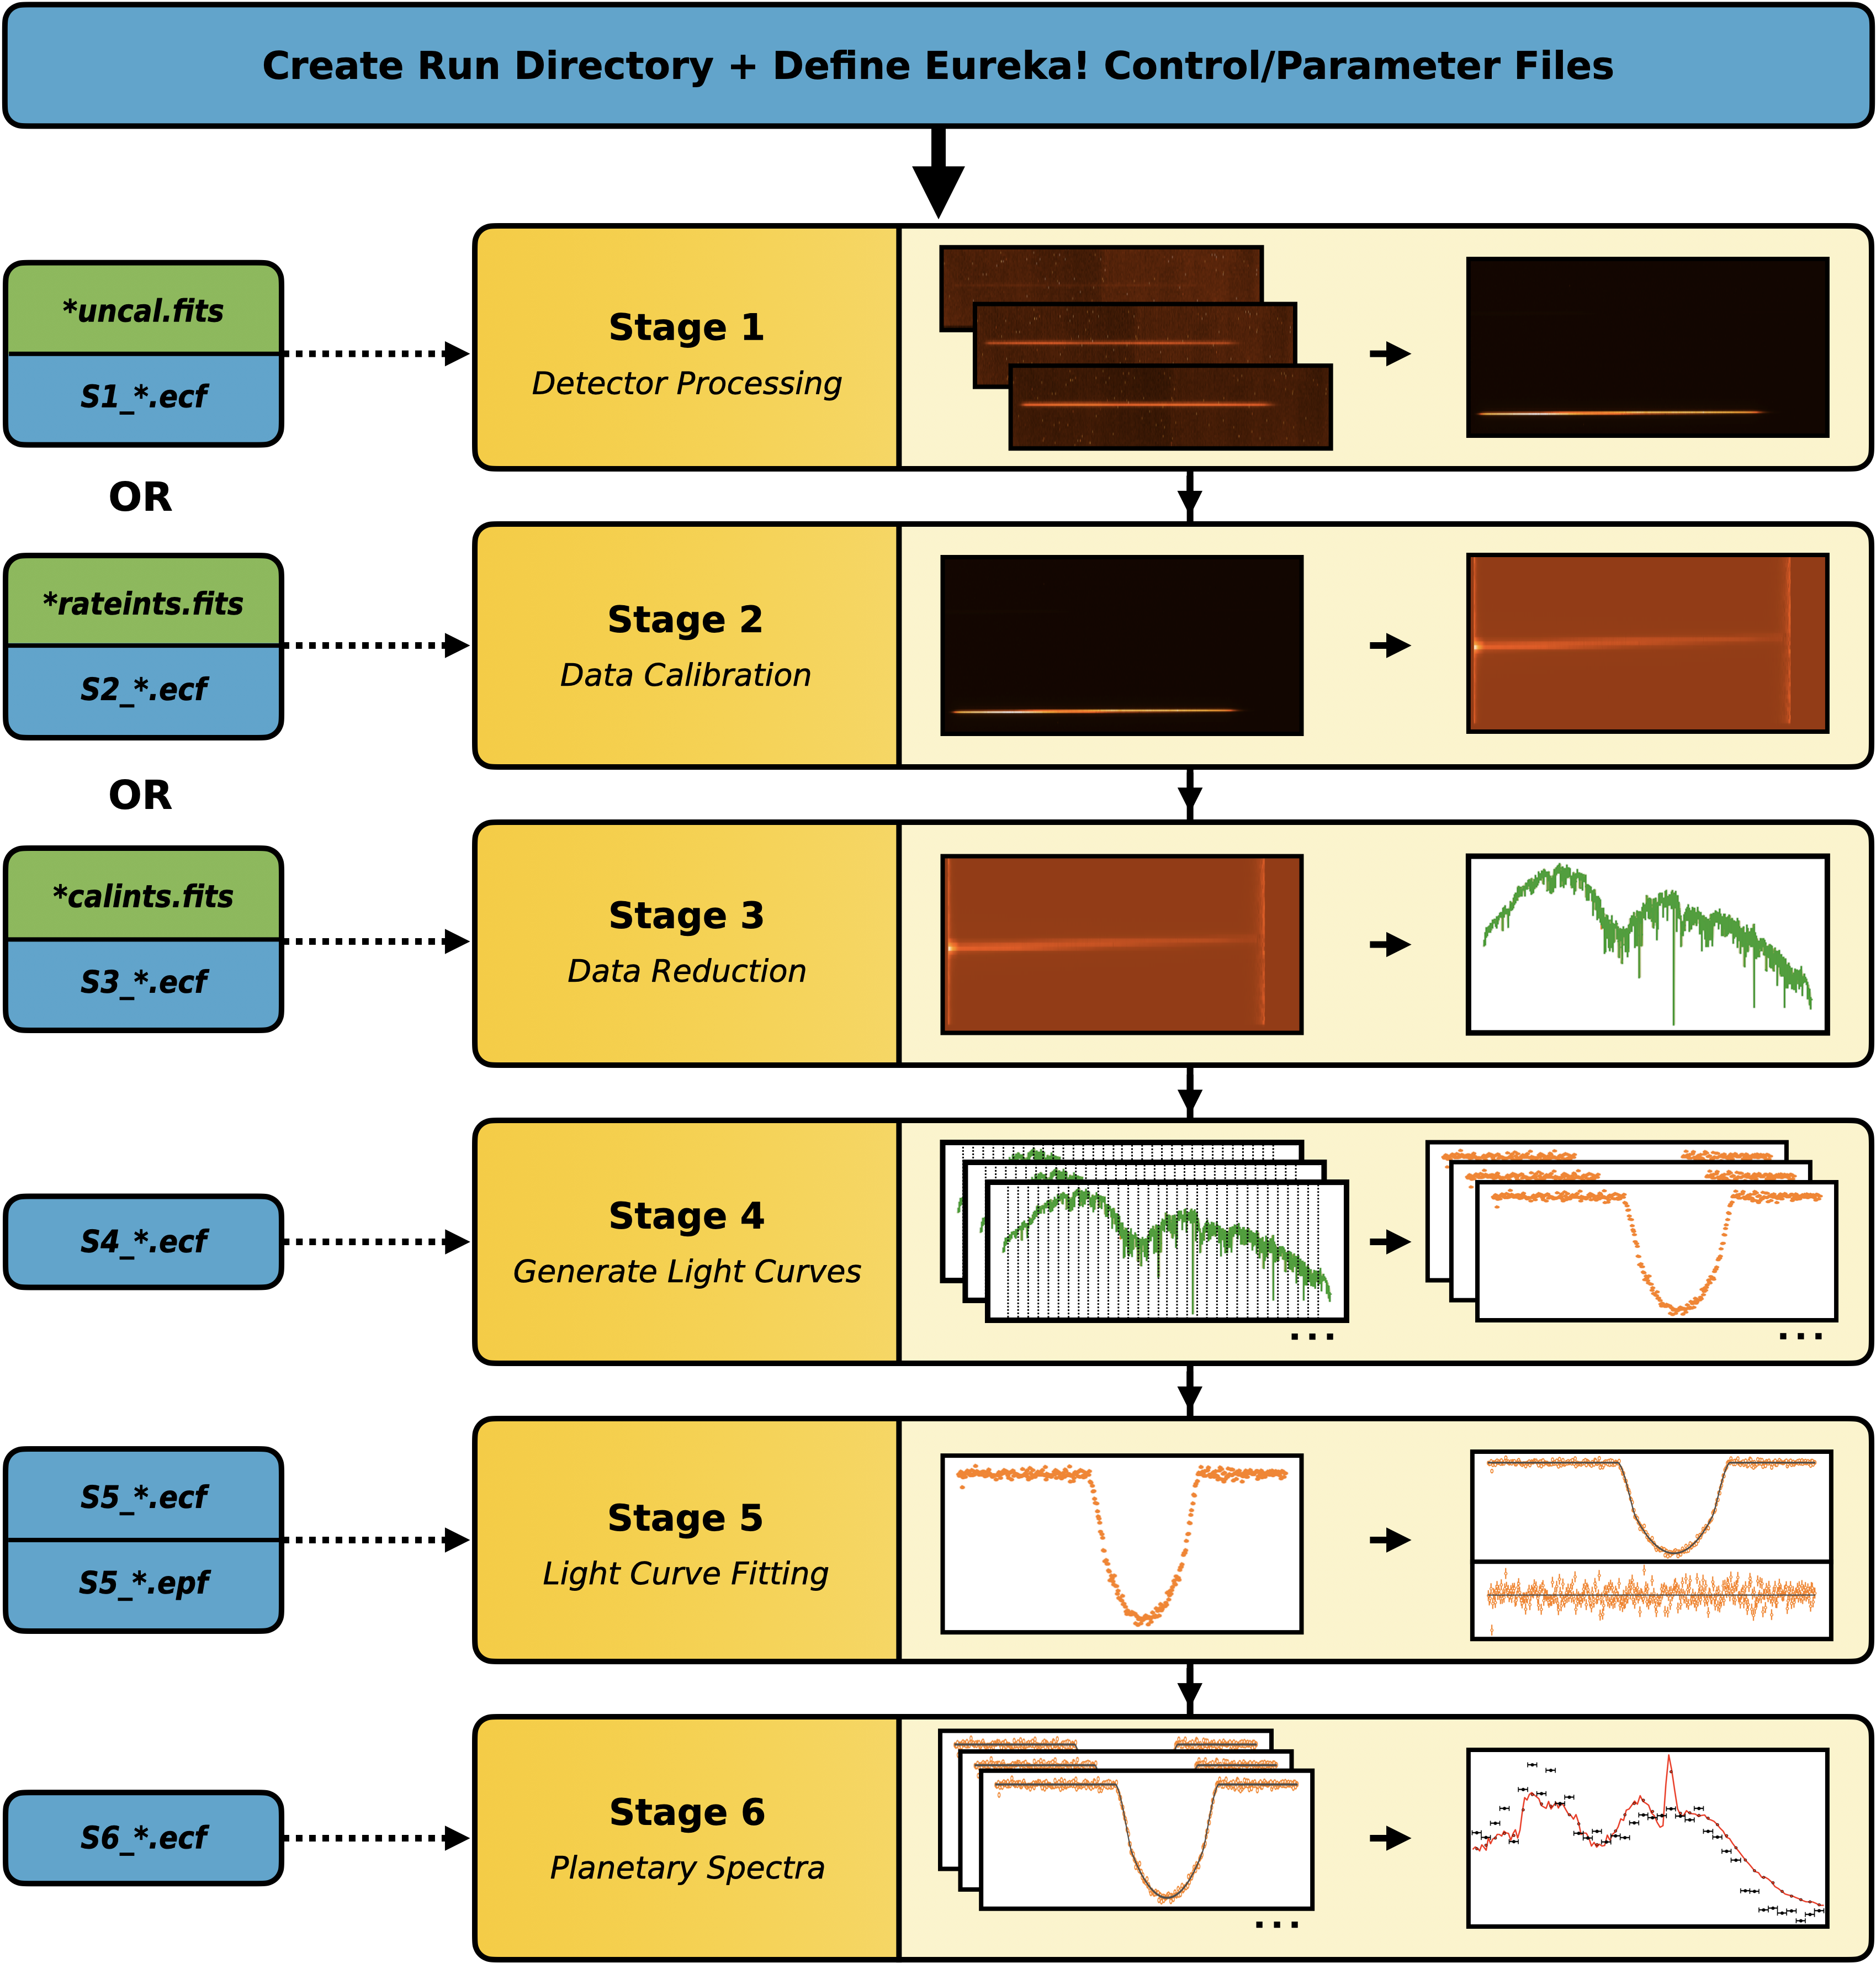
Figure 1: An overview flowchart of the 6 stages of Eureka!.
Stage 3: Data Reduction
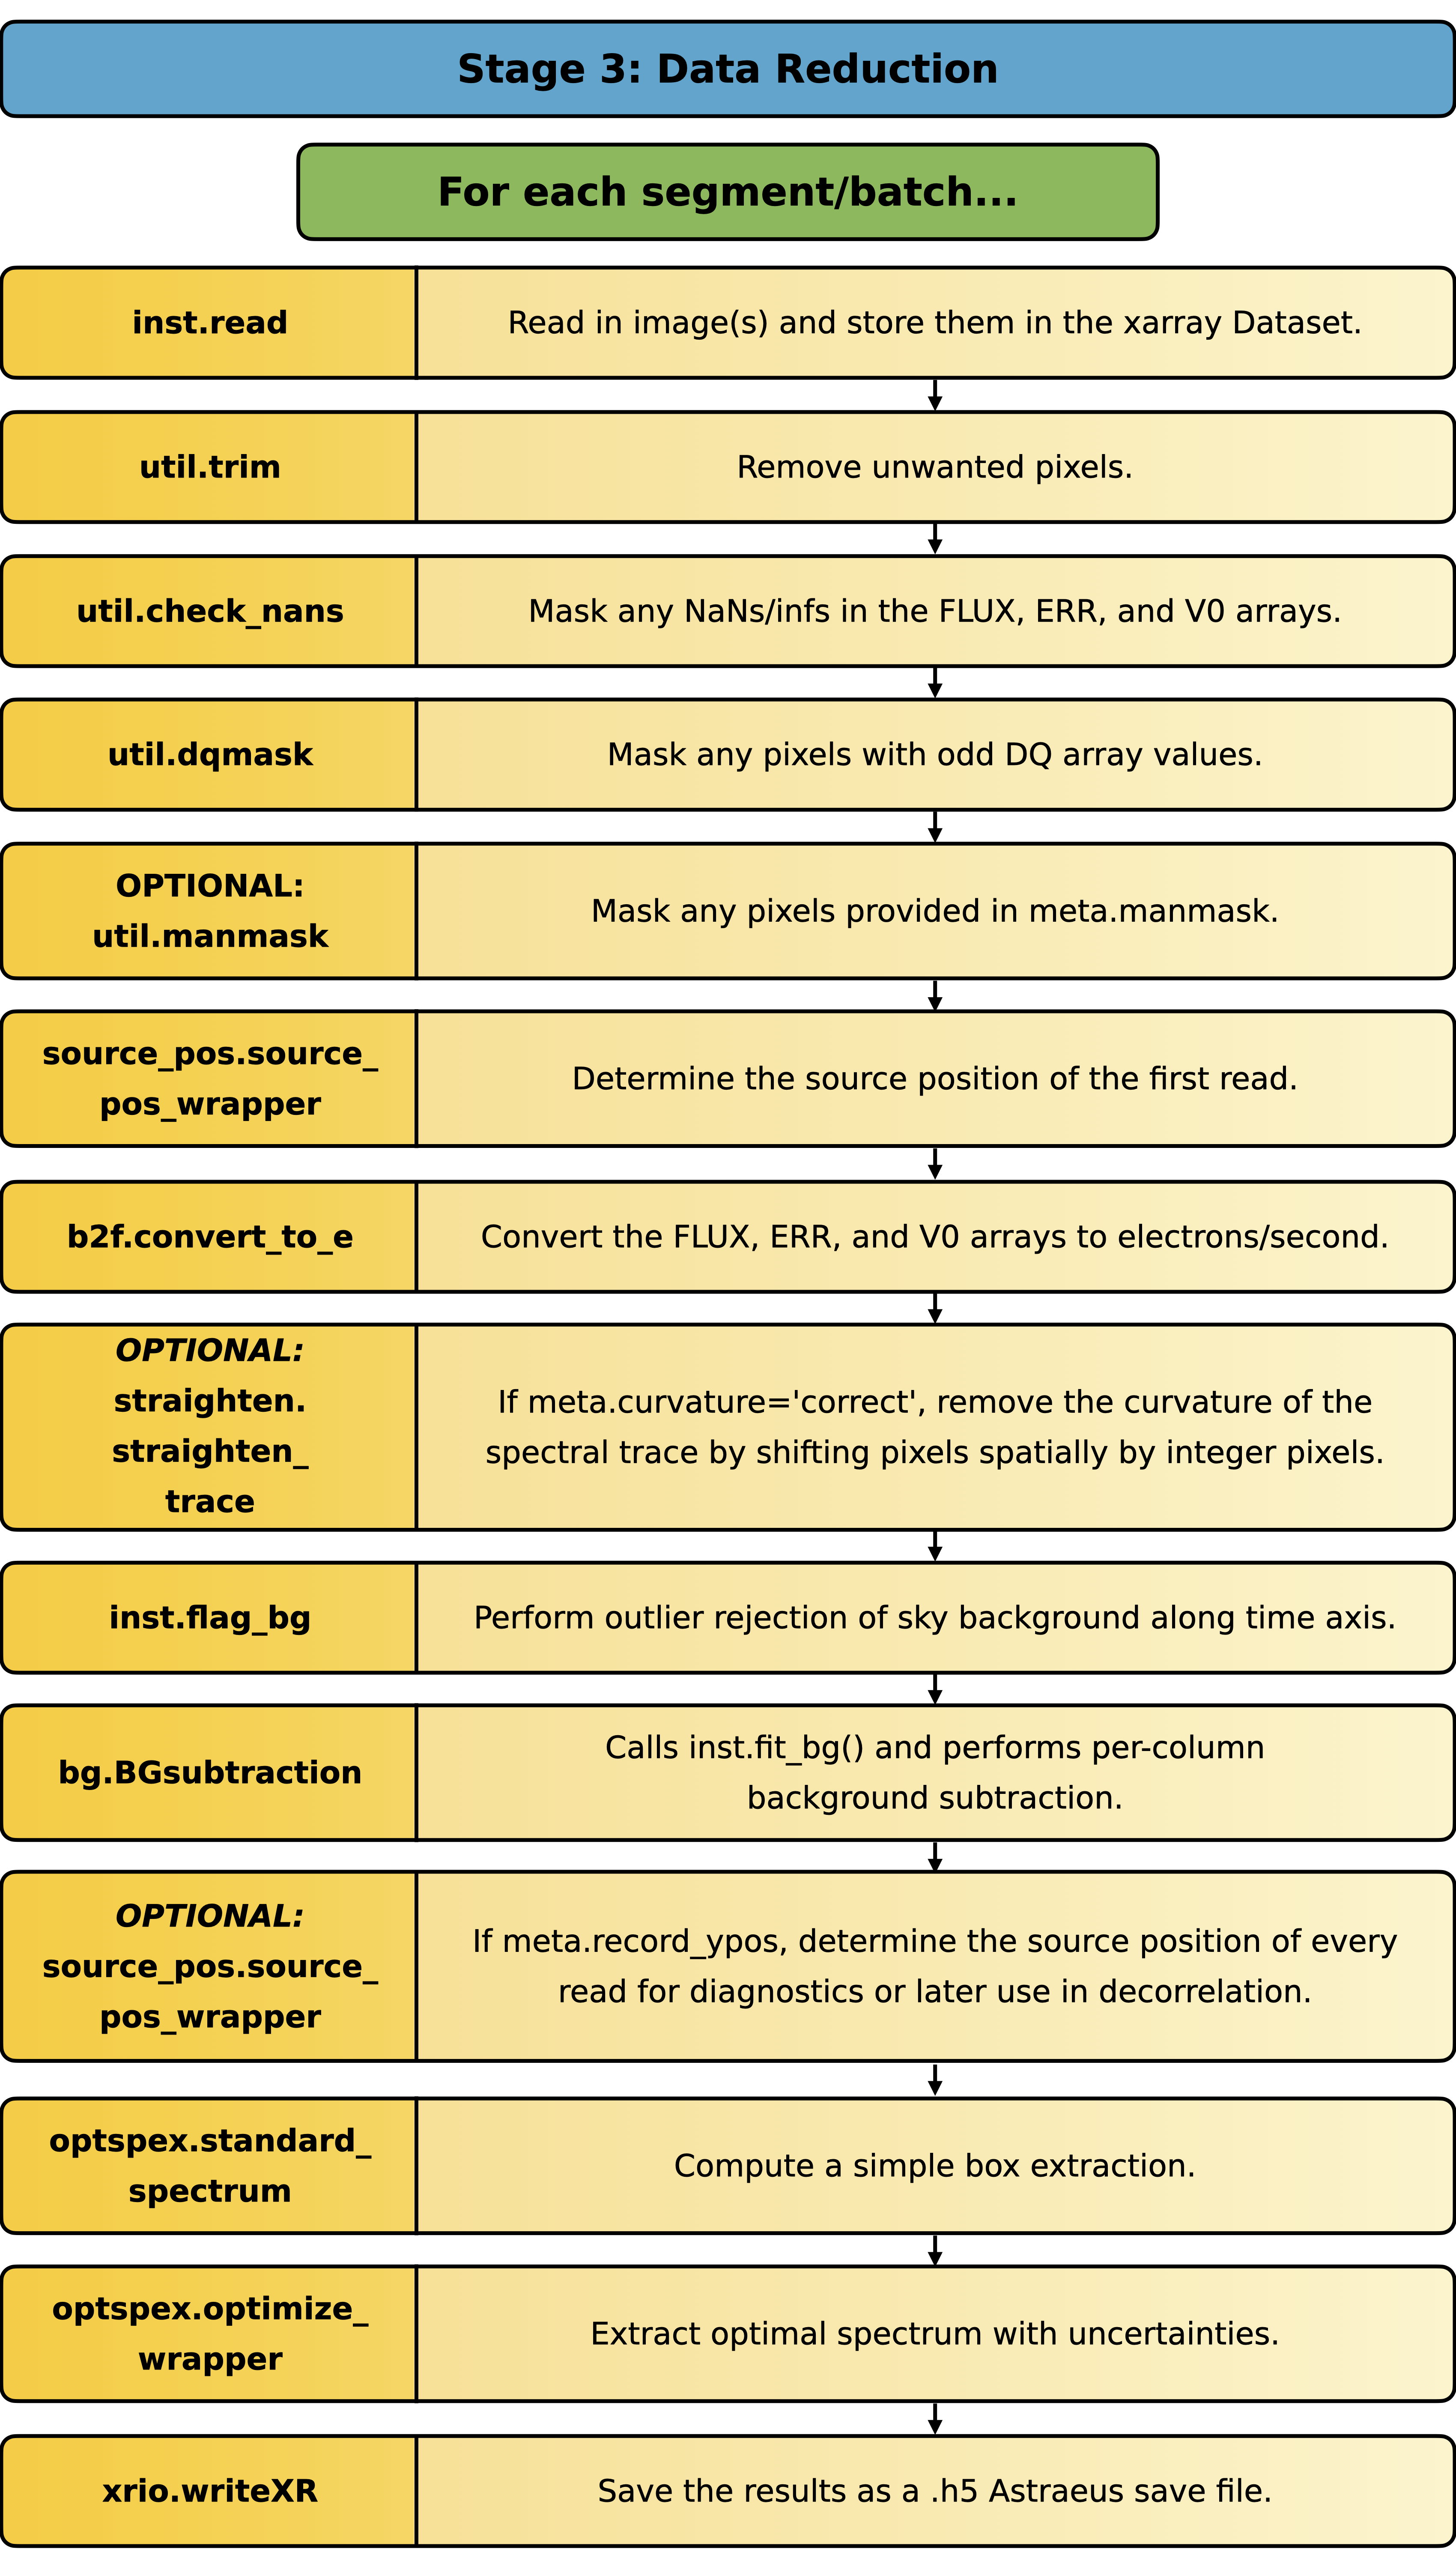
Figure 2: An overview flowchart of Eureka!’s Stage 3.
Stage 4: Generating Lightcurves
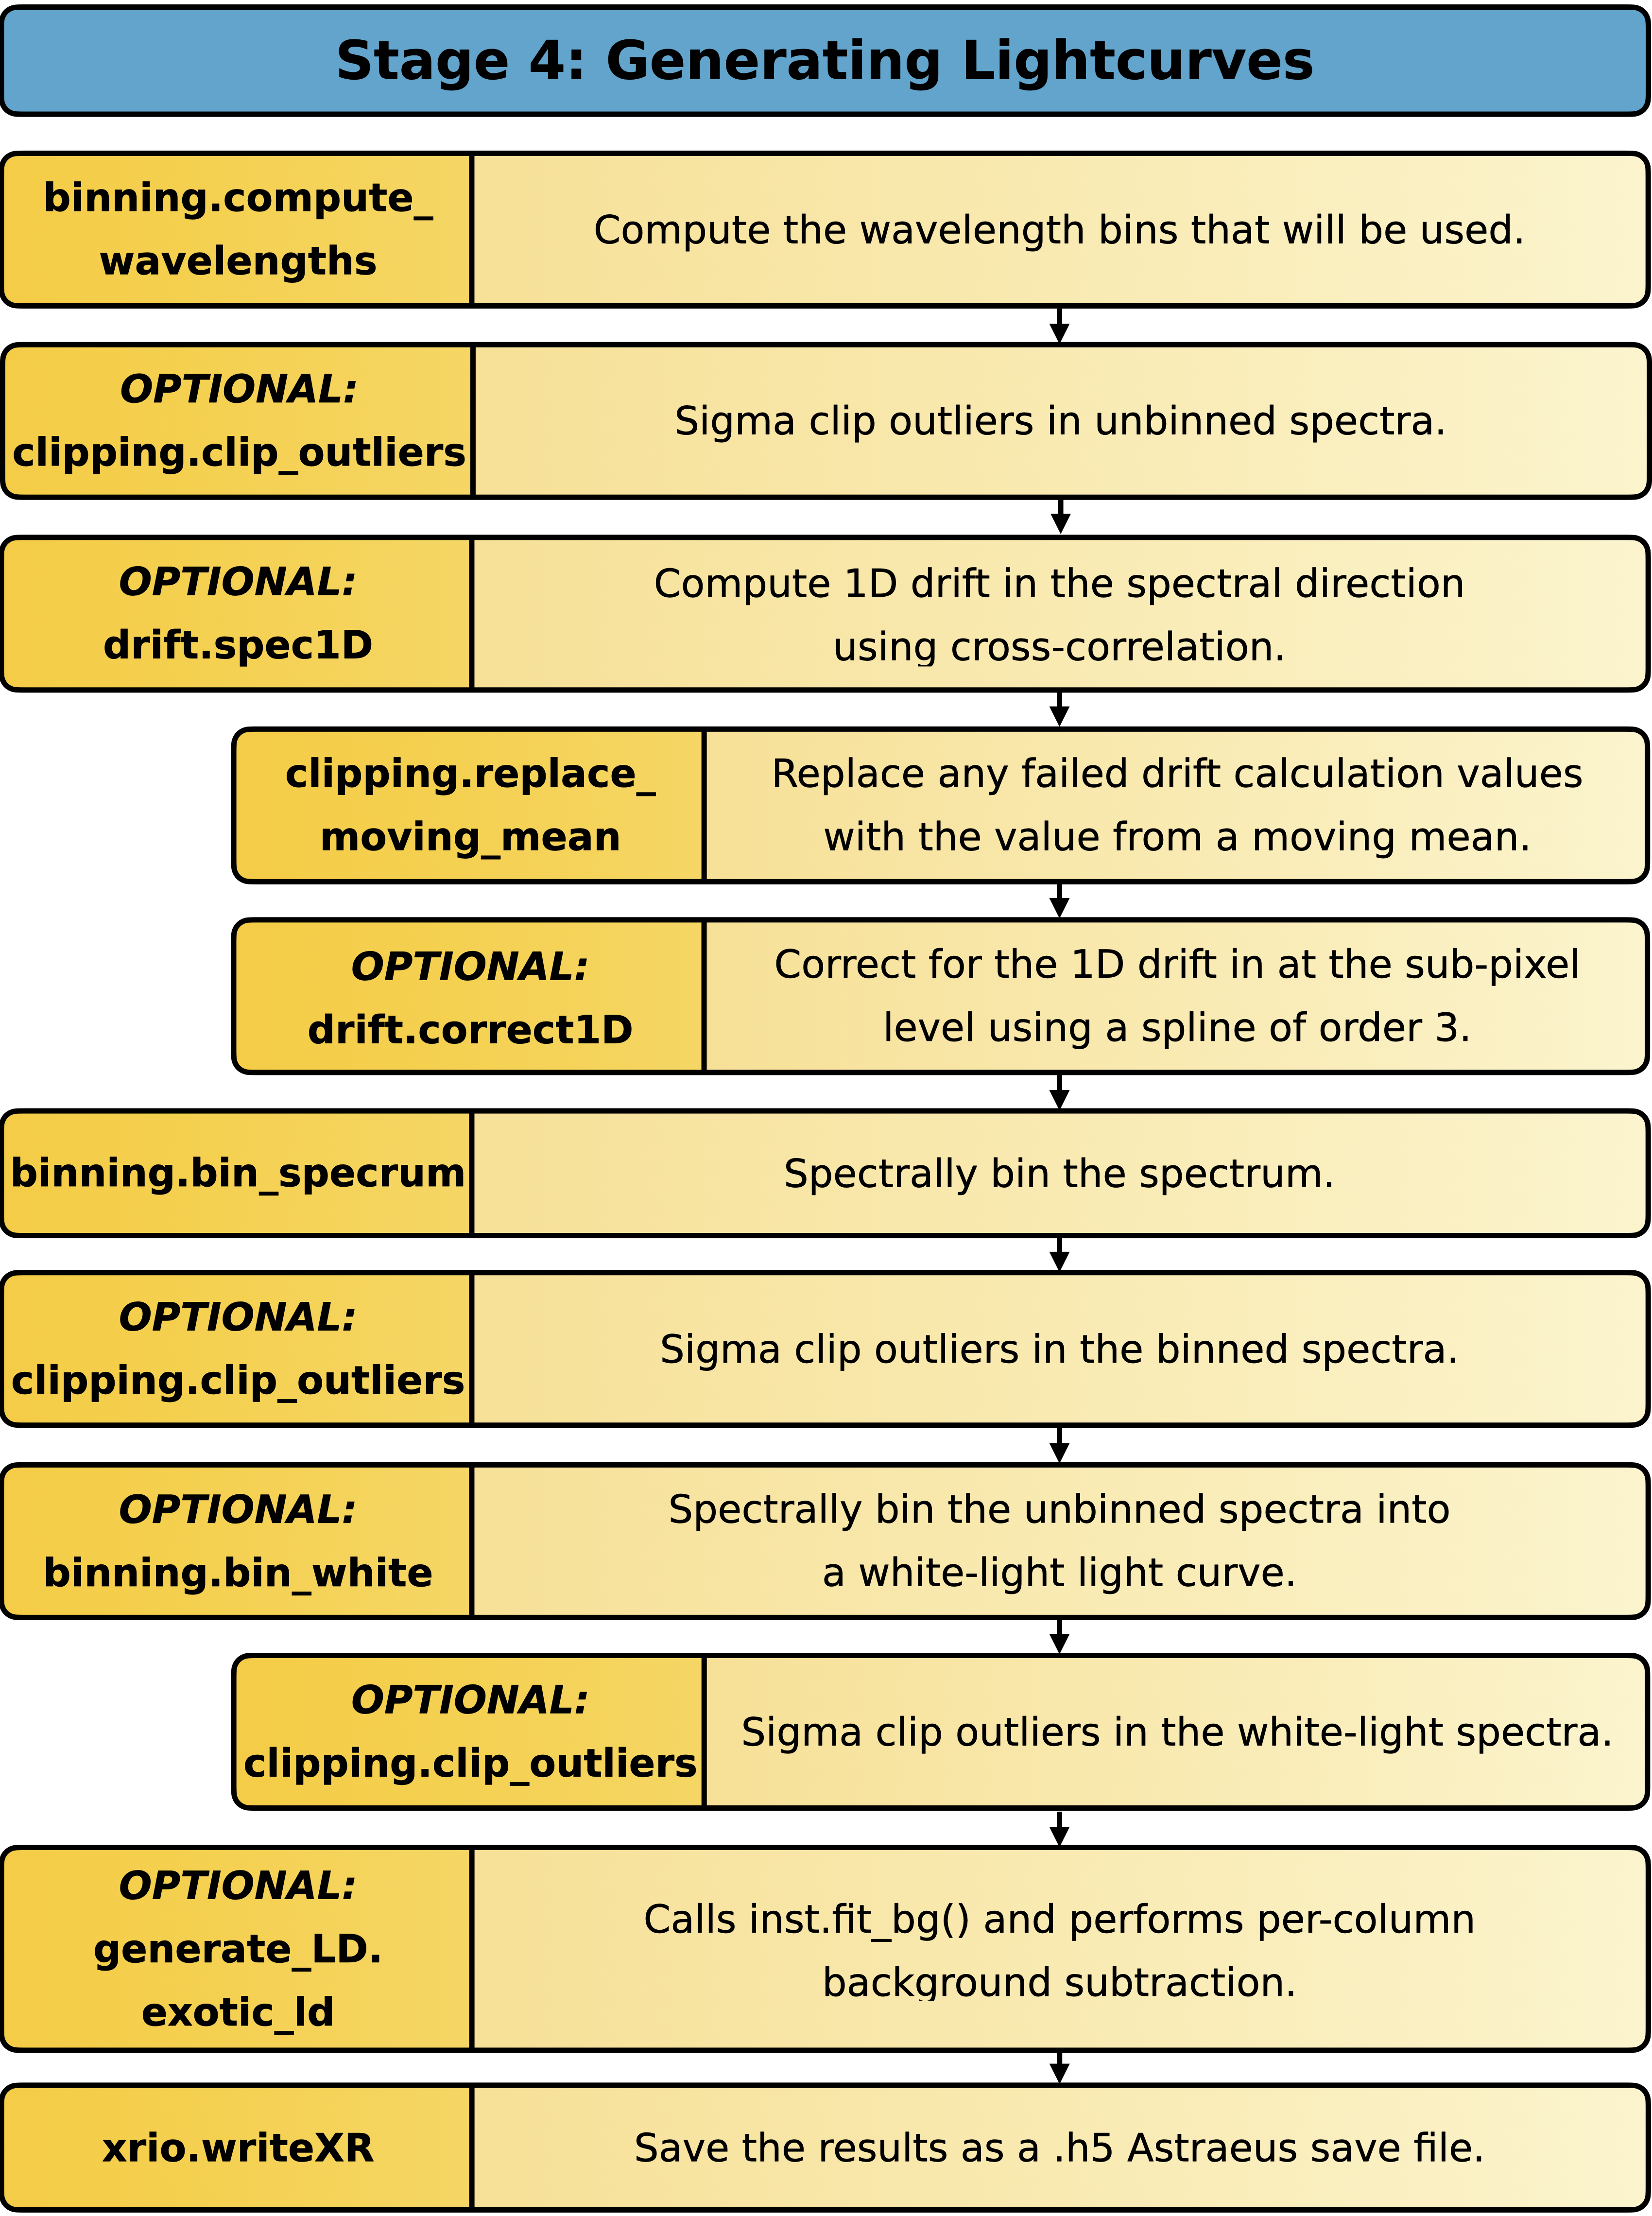
Figure 3: An overview flowchart of Eureka!’s Stage 4.